NanoAOD analysis: Make the plots
Overview
Teaching: 5 min
Exercises: 5 minQuestions
How can I make high quality plots with ROOT?
Objectives
Make plots of all observables
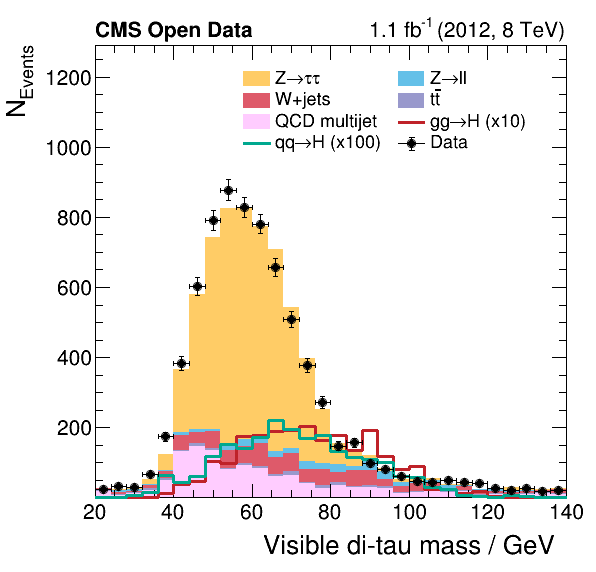
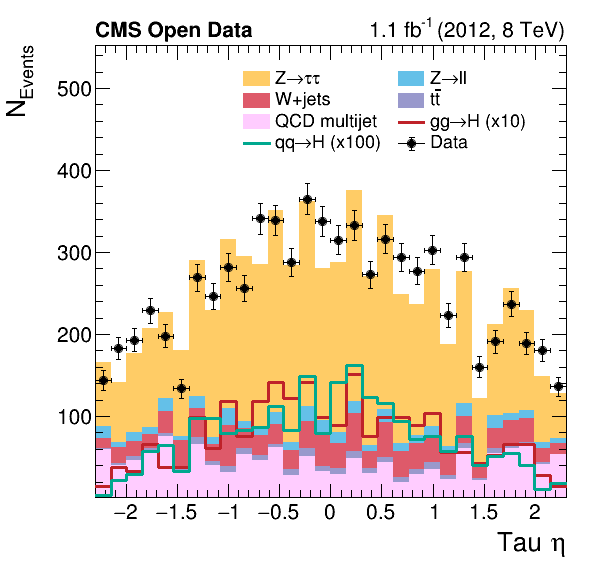
Finally, the histograms we produced in the previous section are combined to produce the final plots showing the data taken with the CMS detector compared with the expectation from the background estimates. These plots allow one to study the contribution of the different physics processes to the data taken with the CMS detector and represent the first step towards verifying the existence of the Higgs boson.
This step is again implemented in Python for convenience and can be found in the file plot.py, which you can download here.
Investigate and run the Python script!
Have a look at the code and run it! Note again that the program picks up the files from the same directory in which you run it.
Investigate the output!
The Python script generates a
pngand a
Key Points
The plotting combines all histograms to produce estimates of the physical processes and create a figure with a physical meaning.
The plots show the share of the contributing physical processes to the data, but without systematic uncertainties.
The script shows how you can produce paper quality plots with ROOT!